Analyzee Heatmap Overview
Discover Insights with Heatmaps in Analyzee
At Analyzee, heatmaps serve as dynamic visualizations to uncover valuable insights from your data. Whether you're tracking user behavior, analyzing geographic patterns, or monitoring trends, our heatmap feature empowers you to explore data in an intuitive and customizable manner.
 Heatmaps in Analyzee
What is a Heatmap in Analyzee?
Think of Analyzee's heatmap as a personalized lens through which you can explore your data. Instead of drowning in a sea of numbers and figures, our heatmaps allow you to visualize data distribution, concentration, and trends with ease.
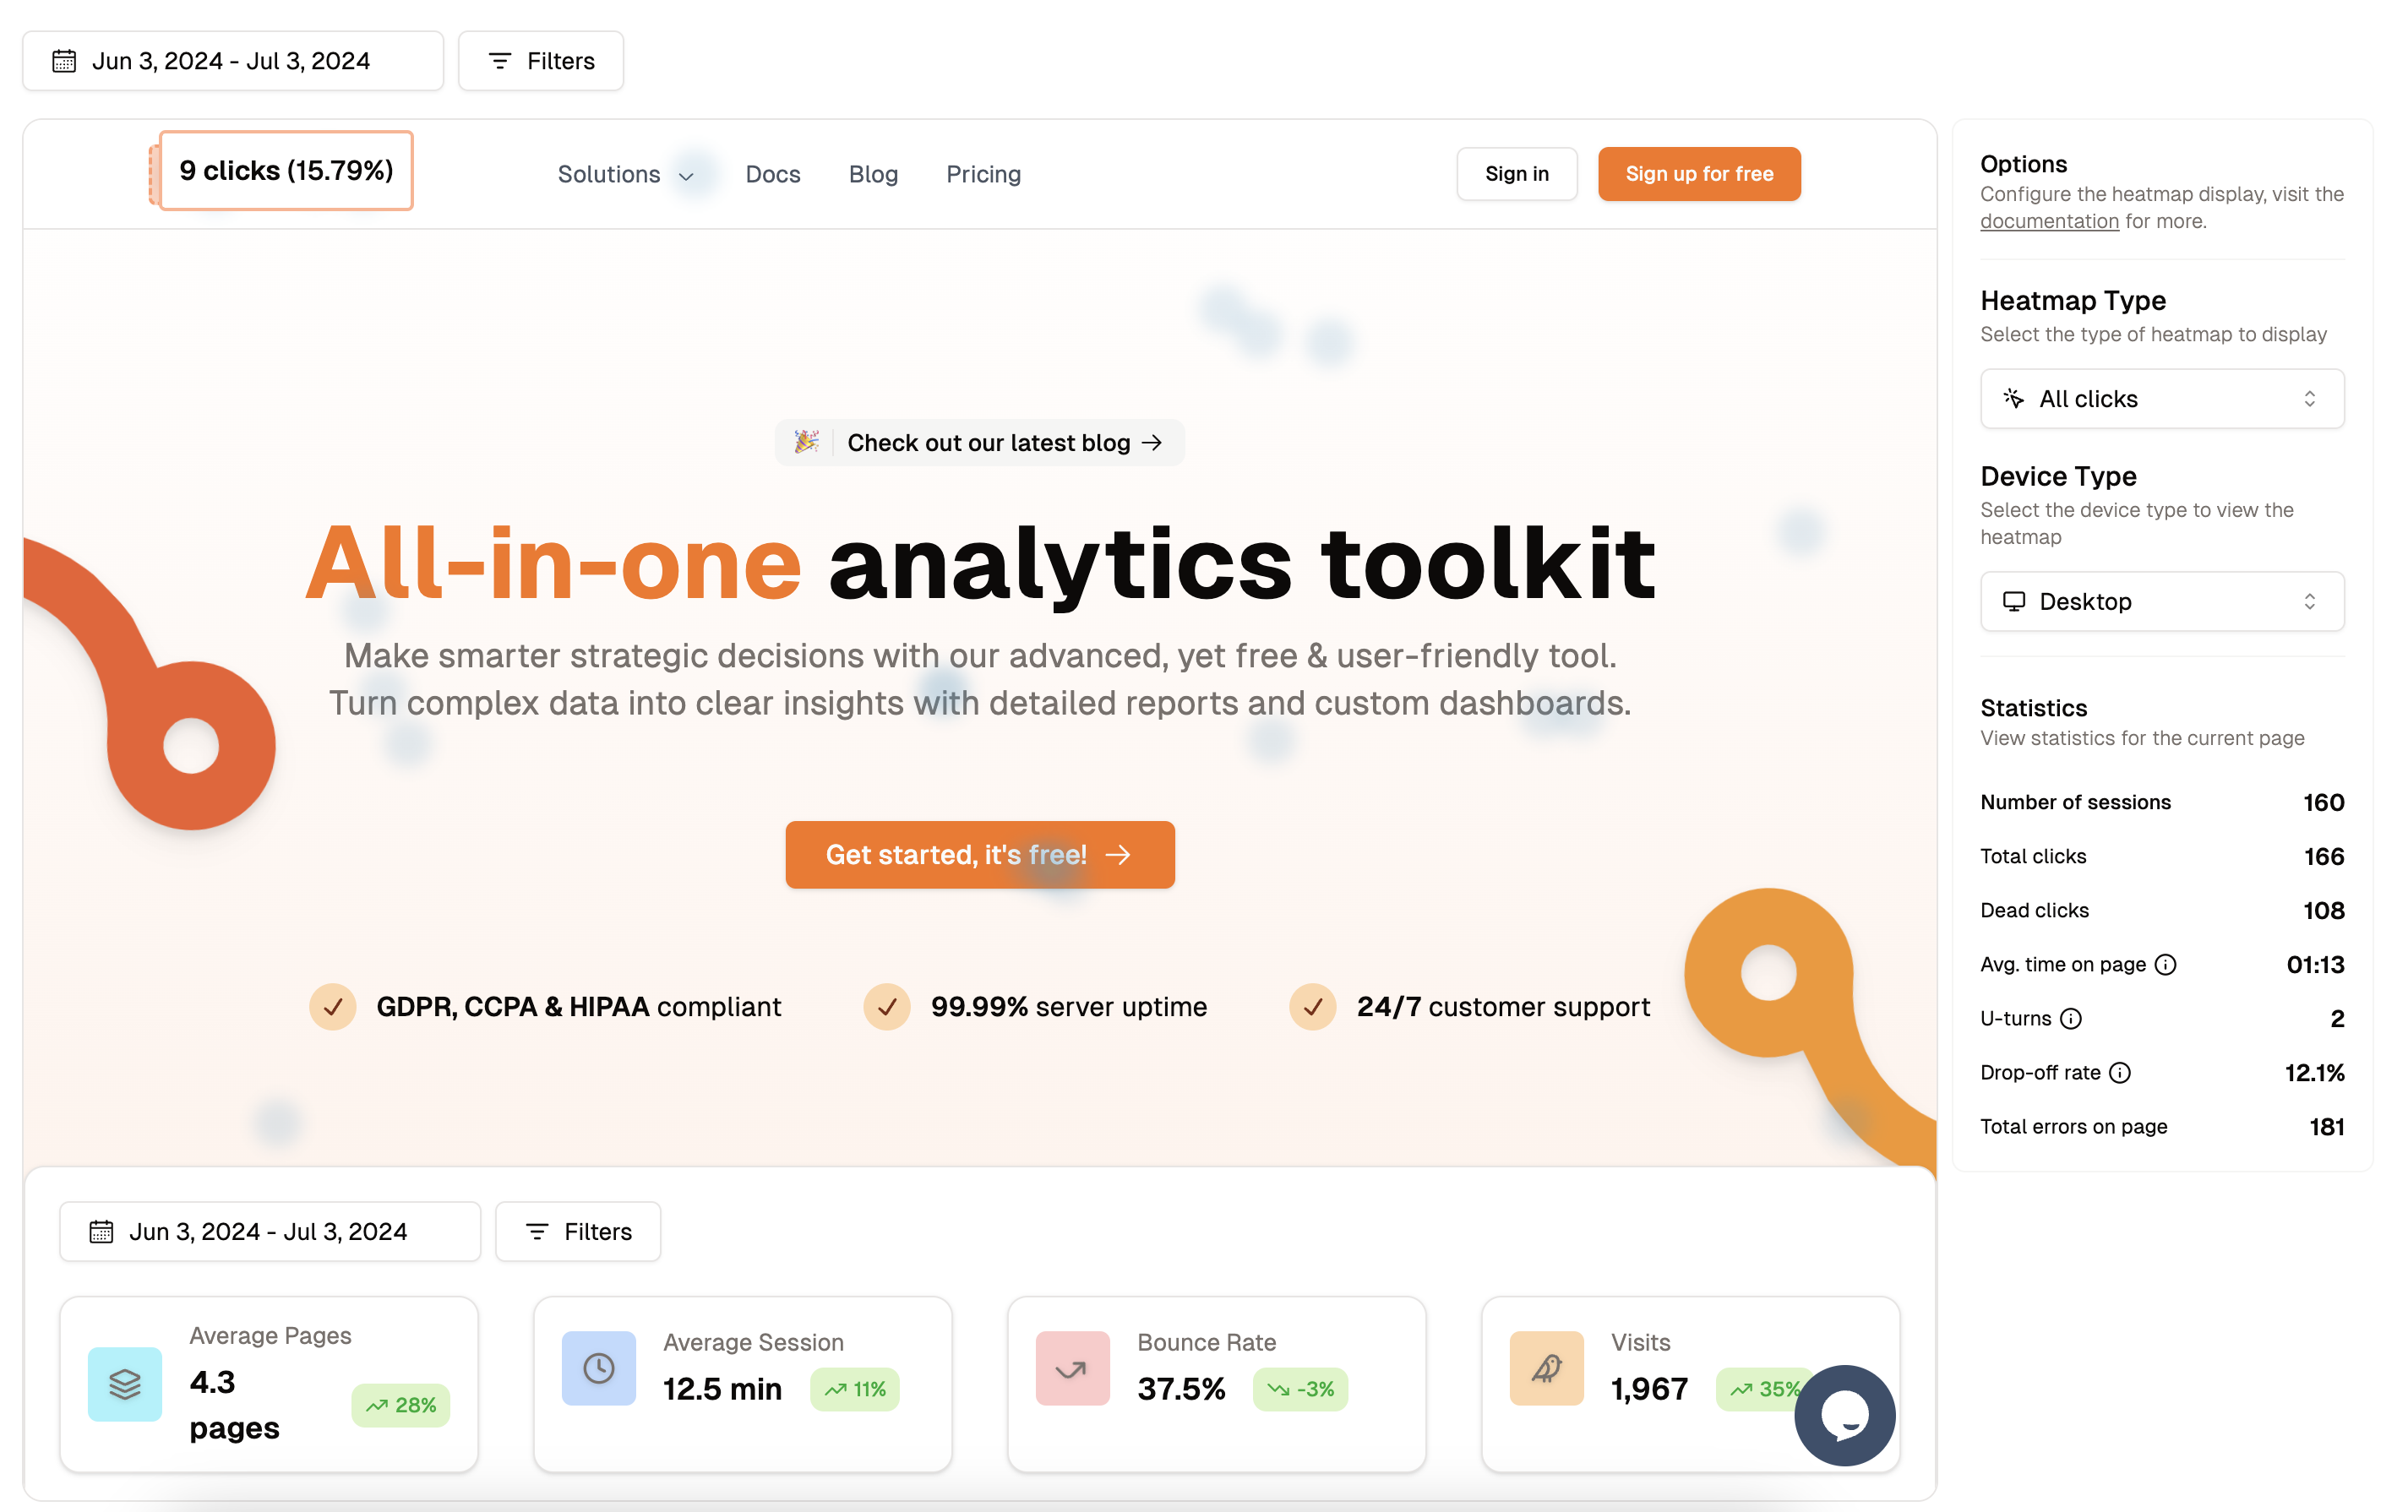
How Does Analyzee's Heatmap Work?
Analyzee's heatmap puts the power in your hands. You select the metrics, dimensions, and visualizations that matter most to your analysis. Want to pinpoint high-traffic areas on your website? Interested in identifying hotspots for customer engagement? With Analyzee's heatmap feature, you can tailor your analysis to suit your specific needs effortlessly.
Using Heatmaps Effectively
Analyzee offers a user-friendly interface for designing your heatmap, eliminating the need for complex coding or design processes. Simply drag and drop elements onto the canvas to create your custom heatmap layout. Whether you're adding graphs, charts, or text boxes, our intuitive tools make it effortless to arrange and customize your heatmap to extract actionable insights.
Filtering and Viewing by Device
With Analyzee's heatmap feature, you can filter and view heatmaps based on different devices. Whether you're interested in analyzing user behavior on desktops, mobile devices, or tablets, our platform enables you to segment and visualize data according to your preferences.
Benefits of Analyzee's Heatmaps
- Tailored Insights: Analyzee's heatmaps allow you to customize your analysis to align precisely with your objectives, ensuring that you extract the insights you need.
- Data Exploration: Dive deep into your data landscape with Analyzee's heatmap feature, uncovering hidden patterns and correlations that may not be apparent from raw data alone.
- Effortless Visualization: Constructing heatmaps in Analyzee is a breeze. With our drag-and-drop dashboard builder and diverse range of visualization options, you can transform your data into meaningful insights in no time.
- Iterative Analysis: Analyzee's flexible platform enables you to refine your heatmap analysis iteratively, adapting to changing business needs and evolving data trends effortlessly.
Unlock the full potential of your data with Analyzee's heatmap feature. Explore, analyze, and visualize your data like never before.