Developer Report
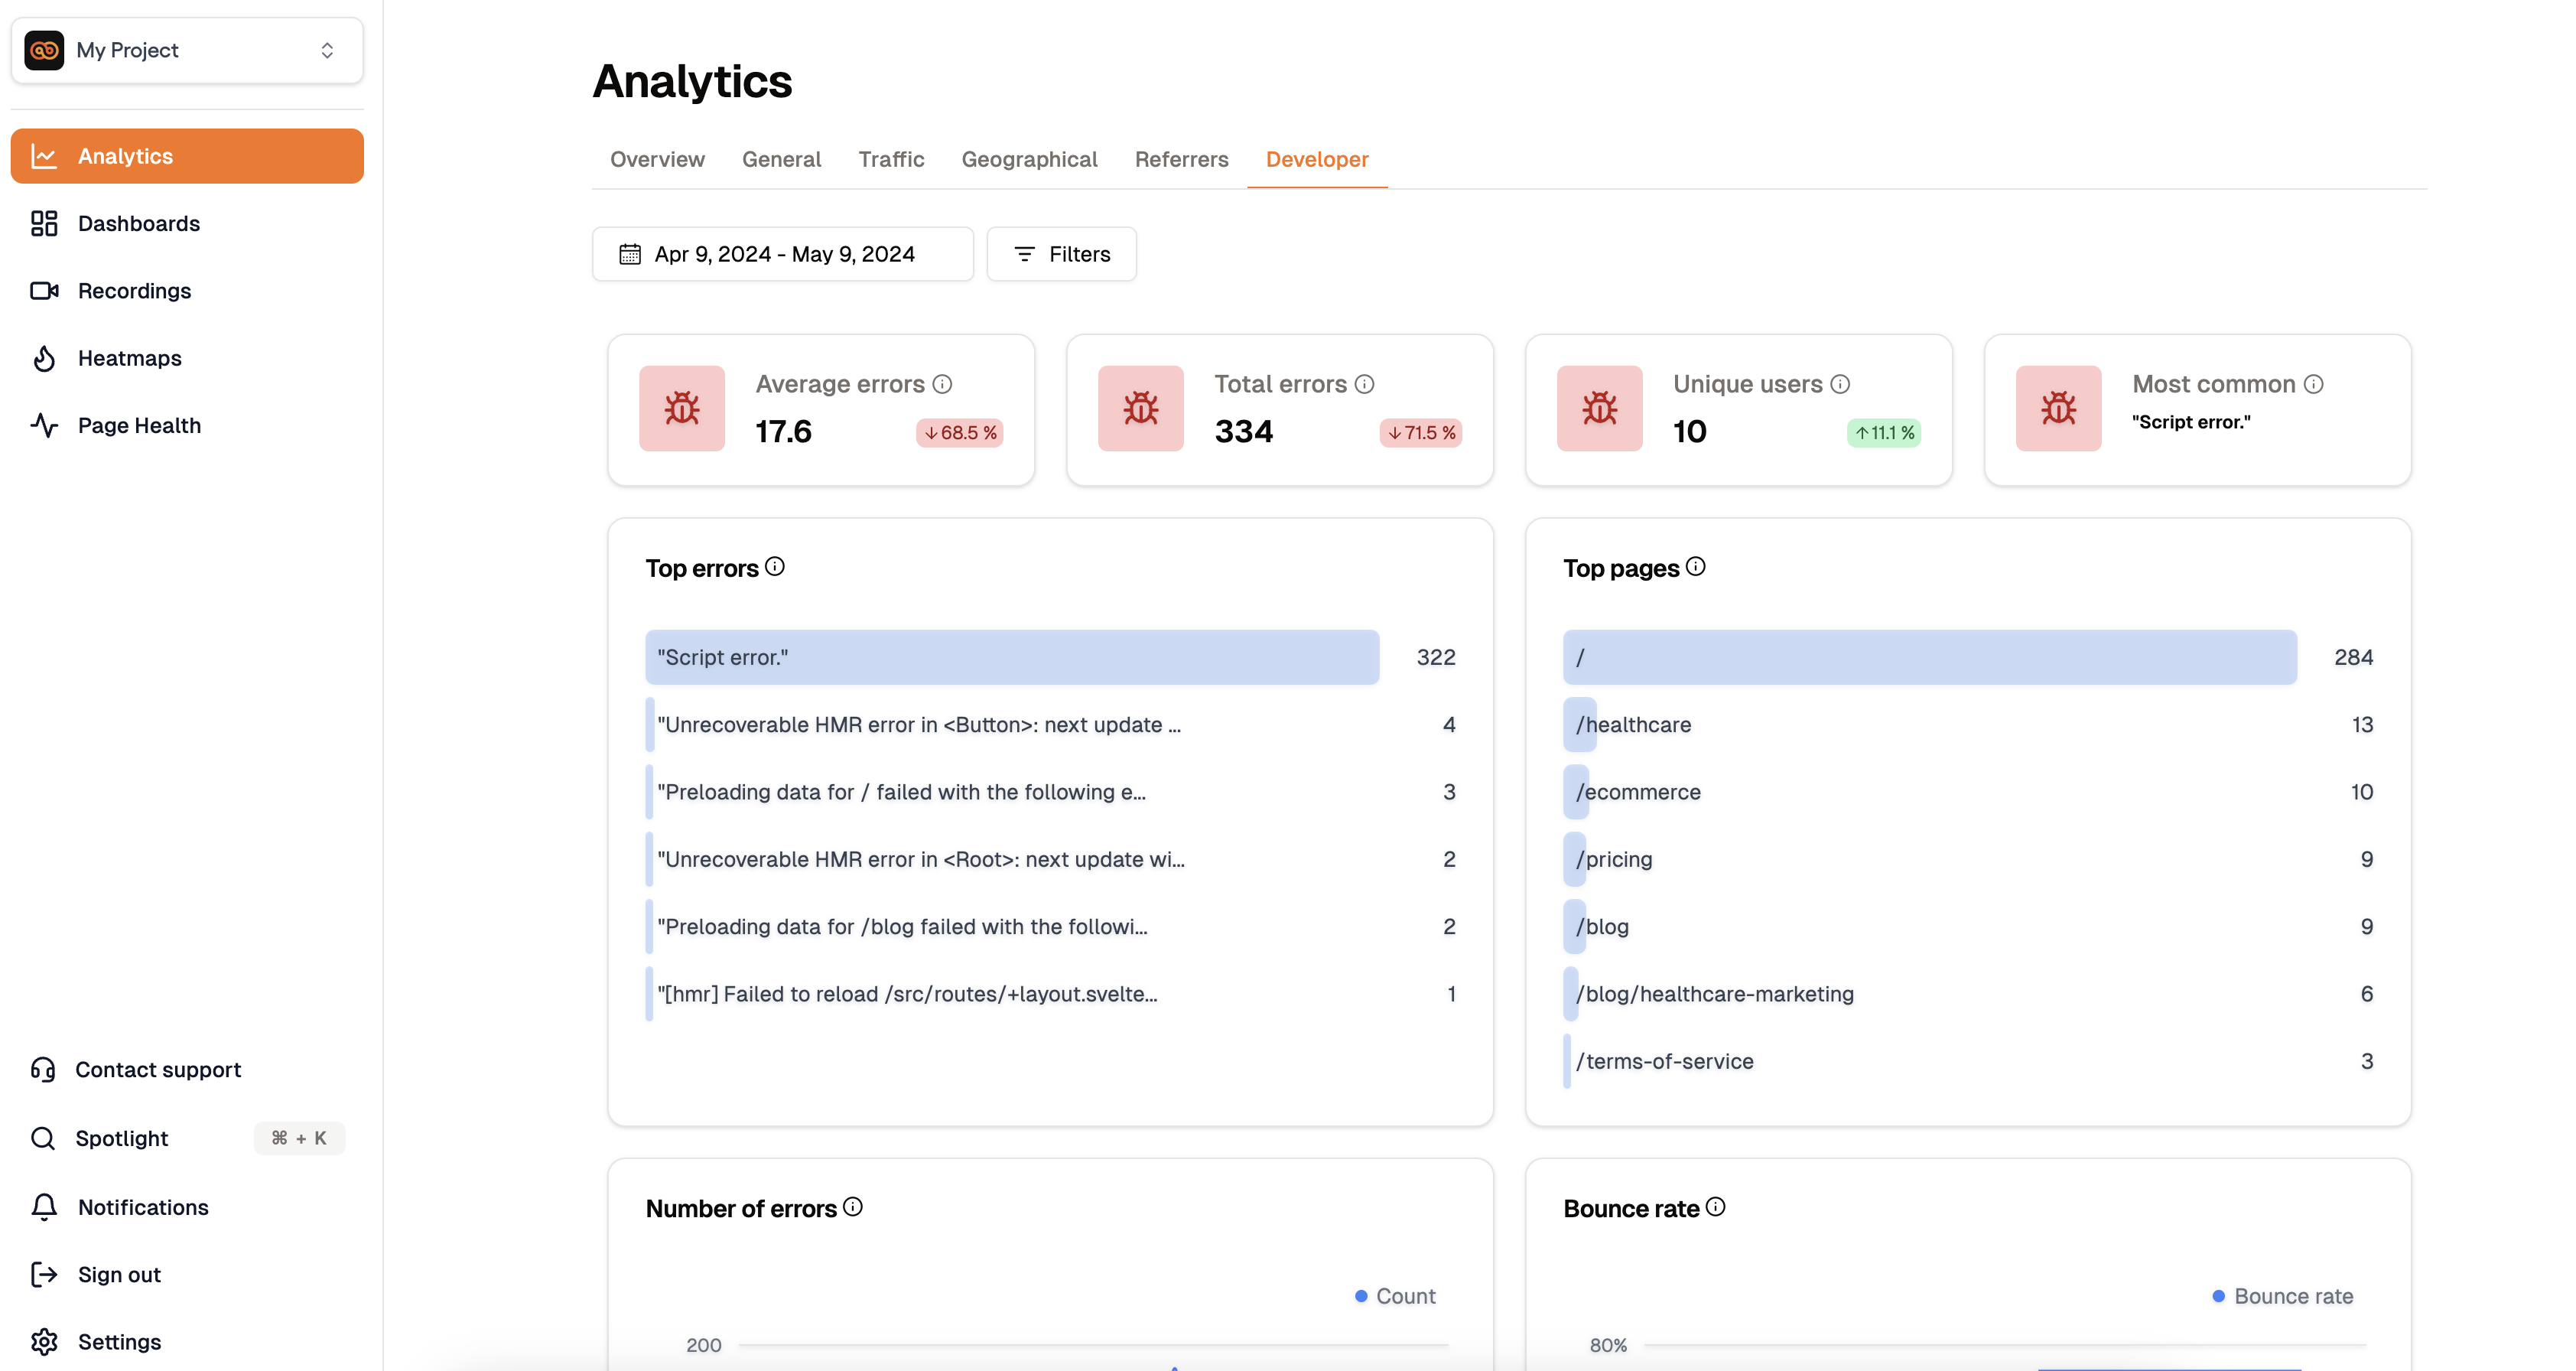
The Developer Report provides insights into website traffic and user engagement based on developer data. It includes information such as users by developer, visitors by developer, bounce rate by developer, conversion rate by developer, and average session duration by developer.
Access the Developer Report
To view the Developer Report:
- Log in to your Analyzee account.
- Once logged in, navigate to the Analytics section of the platform.
- Access the Developer tab within the Analytics service.
- Various metrics and charts will be displayed.
Using the Filters within the Geographical Report
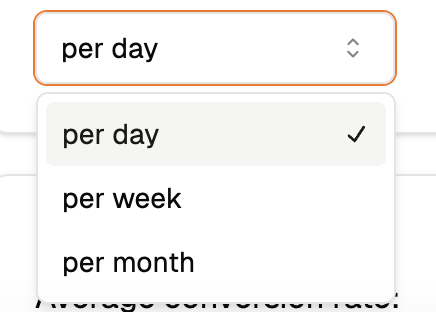
Some charts contain filters that can help you view data in a more useful way.
To learn more about filtering the data within reports, go to Filters
Metrics
Average Errors
- Definition: The number of errors triggered on your website.
Total Errors
- Definition: The total number of errors triggered on your website.
- Calculation: Counting each error triggered on your website.
Unique Users
- Definition: The number of distinct users on your website that triggered an error.
- Calculation: Counting each unique user visit that triggered an error.
Most Common Error
- Definition: The most common error triggered on your website.
- Calculation: Counting the most common error triggered on your website.

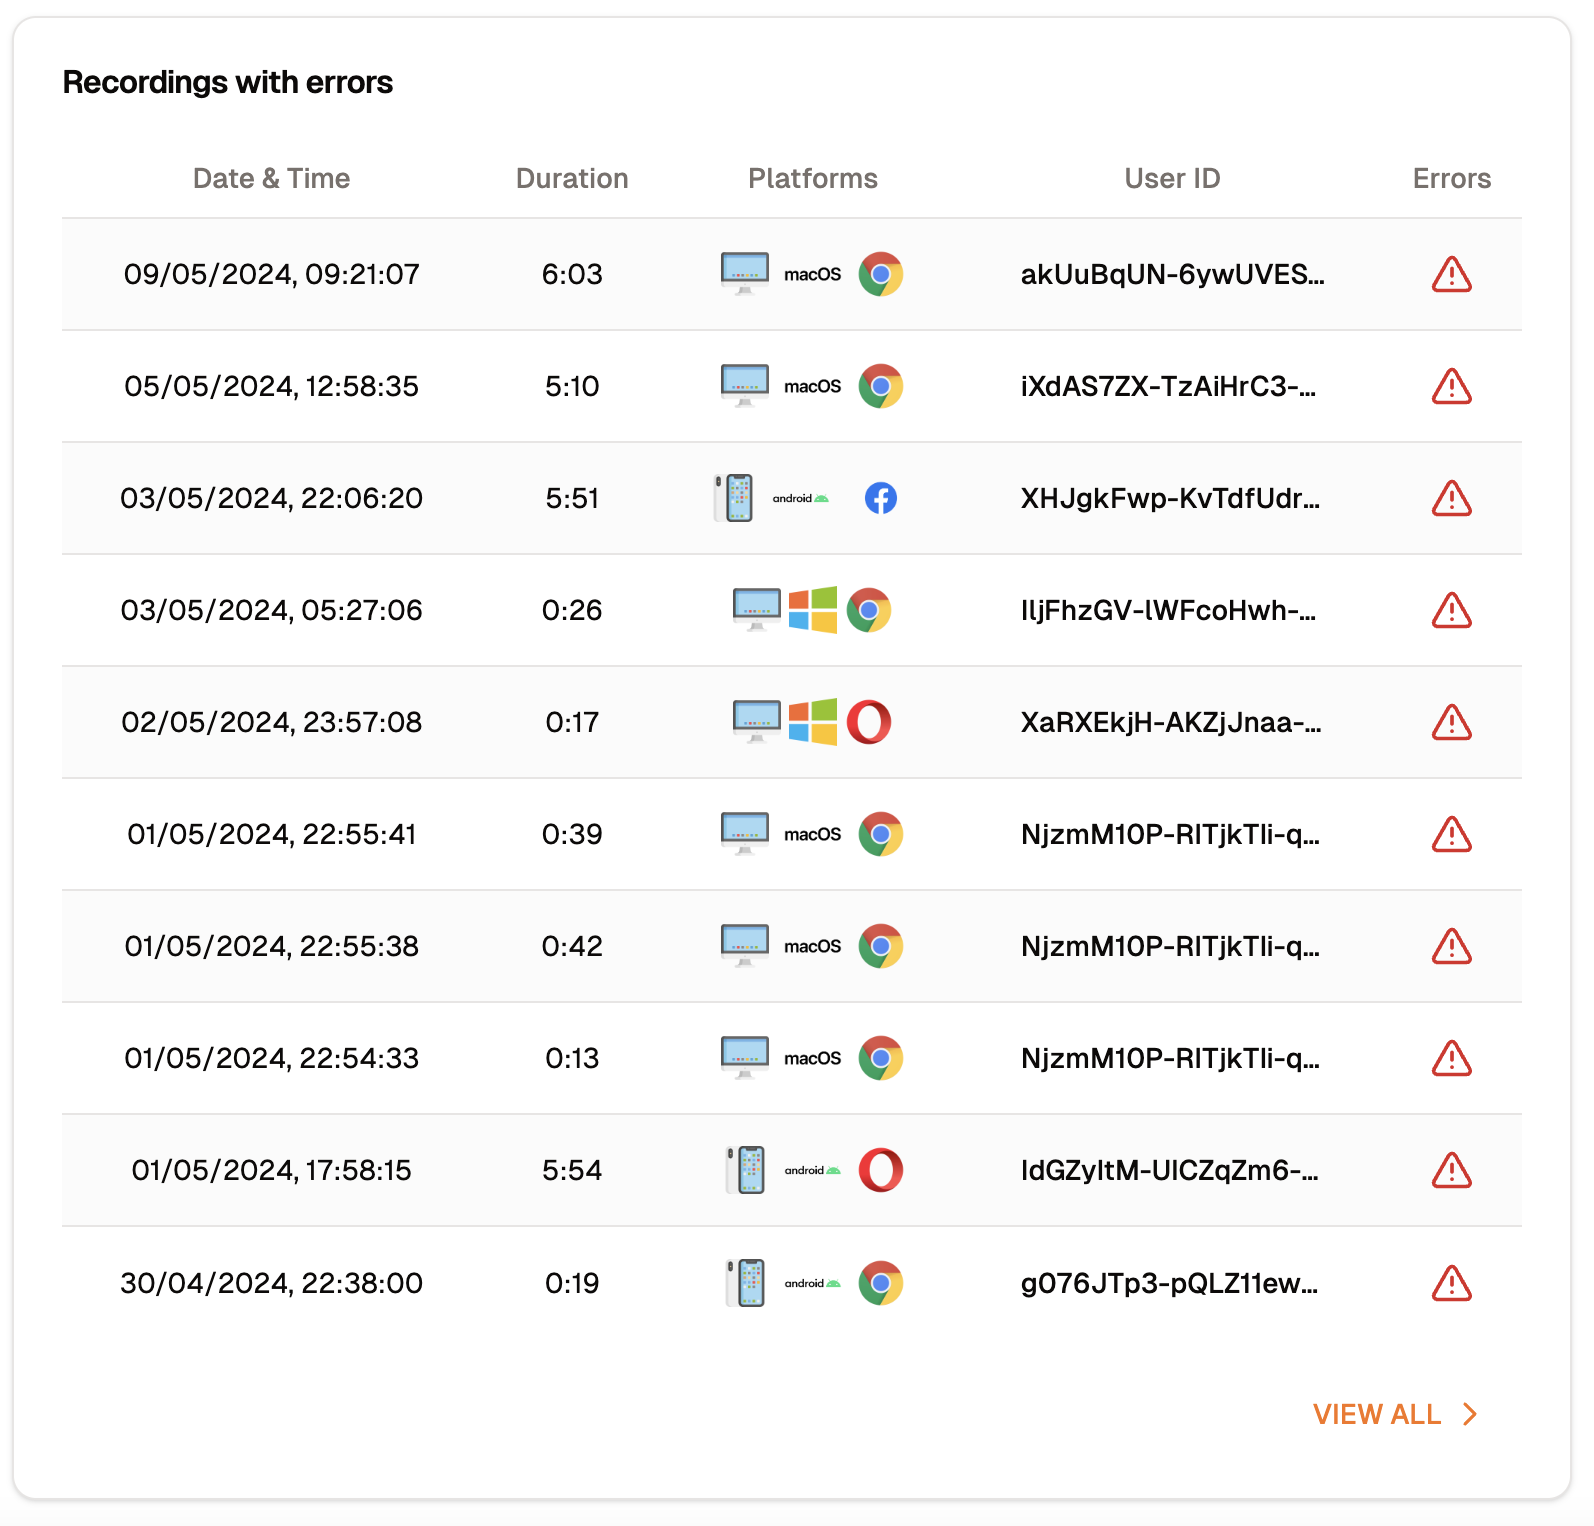
Recordings with Errors
See all the recordings that have errors in them. To learn more about Recordings, go to Recordings.
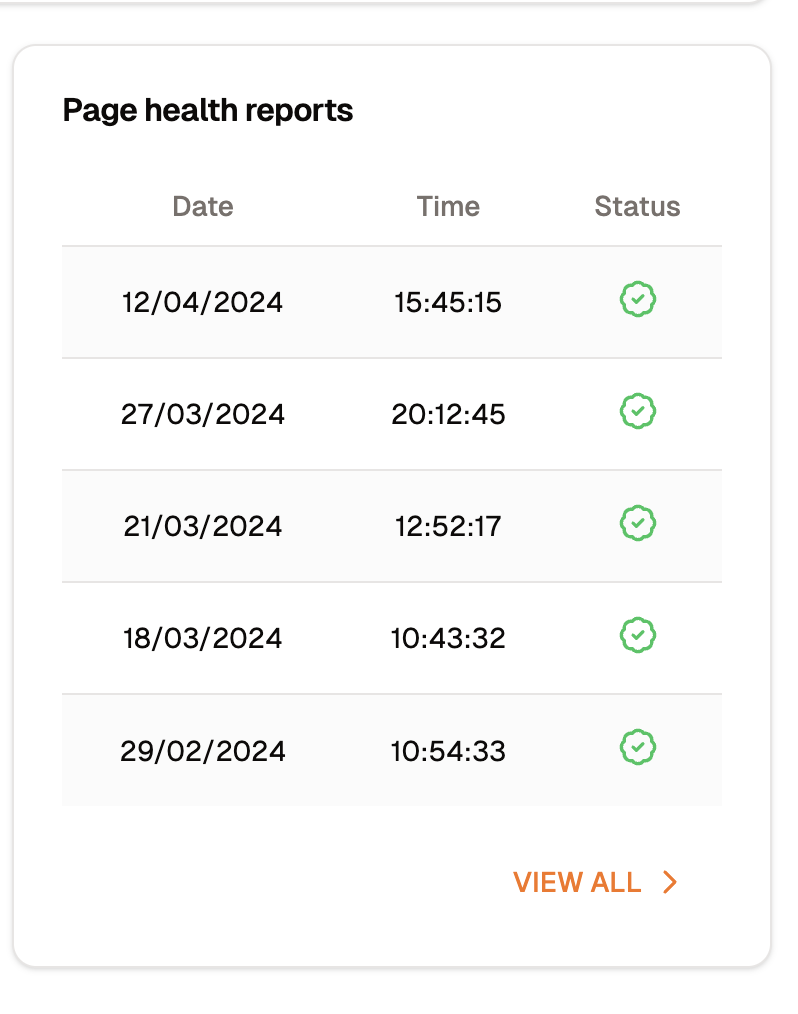
Page Health Reports
See the latest Page Health Reports. To learn more about Page Health Reports, go to Page Health Reports.
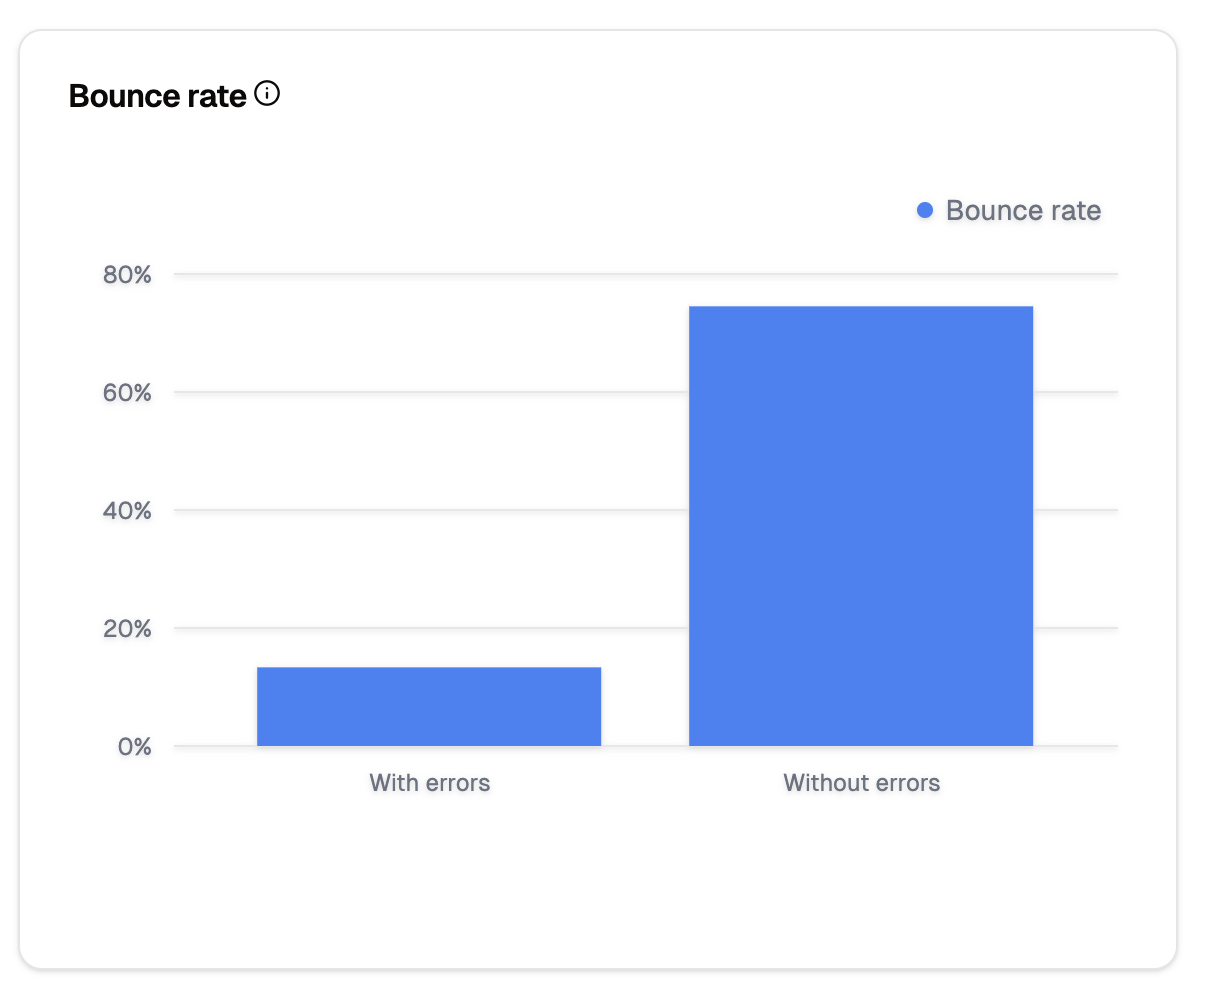
Bounce Rates
Compare how users react to your website based on the error rate.
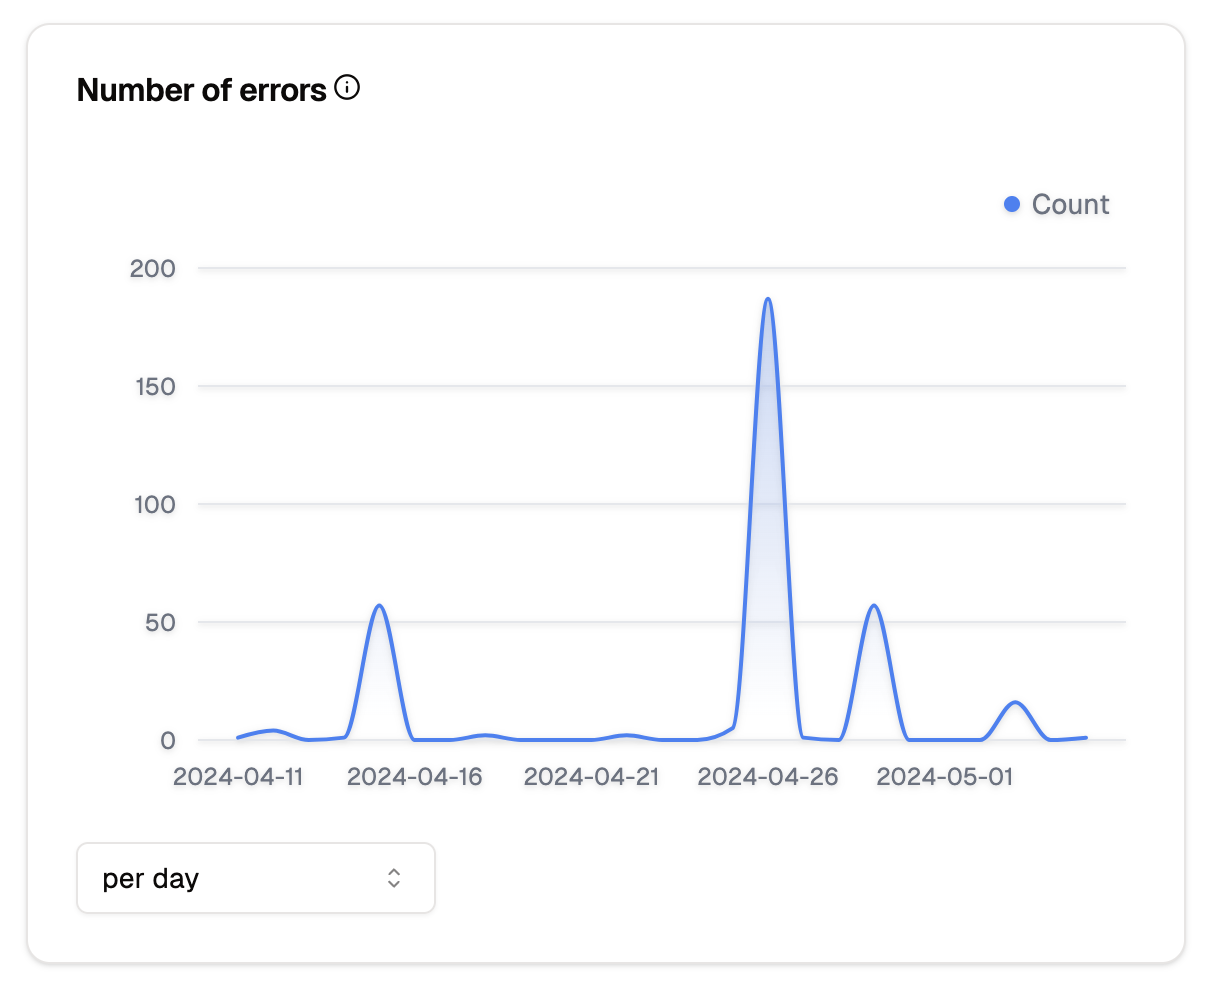
Number of Errors
Use the line chart to see the number of errors triggered on your website over time.
